Docker Observability Stack
Overview
I built a fully containerised support ticket API built with Flask and PostgreSQL, featuring a complete observability stack. Prometheus scrapes live metrics, Grafana visualises real-time traffic, Alertmanager fires alerts when the app goes down, and Locust simulates concurrent user load. Orchestrated with Docker Compose across a custom bridge network.
You can find the code files in this GITHUB REPO. To run it you will need:
- Docker installed locally
- Docker-compose installed locally
Check out the project's readme file for instructions on how to download it and run it on your machine
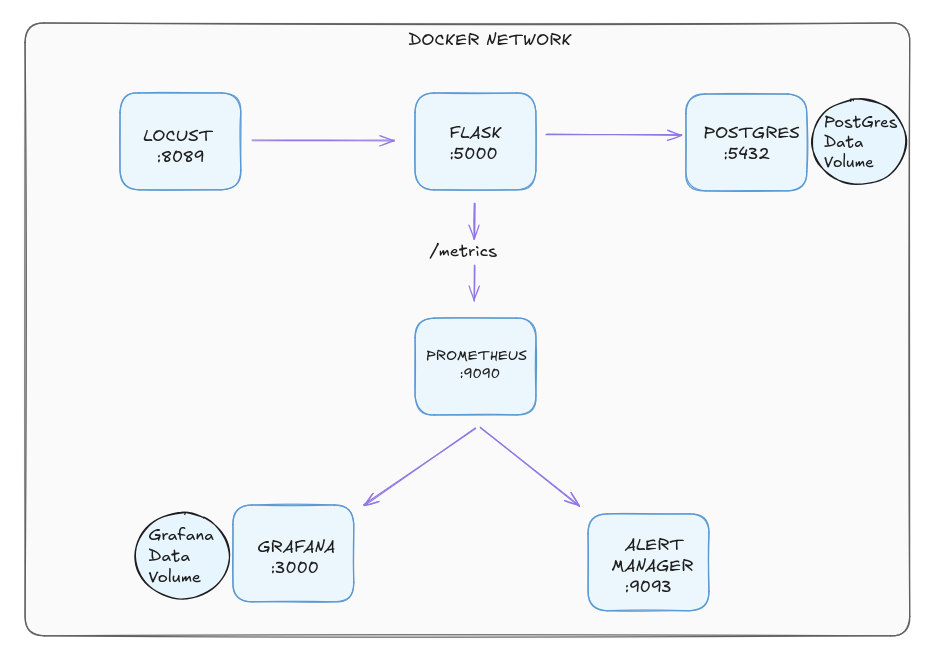
Architecture
Docker network consisting of 6 containers
Here are the urls and port numbers to access them
- Flask API - http://localhost:5000 | Support ticket API
- Prometheus - http://localhost:9090 | Metrics and alerting rules
- Grafana - http://localhost:3000 | Metrics dashboards
- Alertmanager - http://localhost:9093 | Alert routing
- Locust - http://localhost:8089 | Load testing UI
Docker-Compose
Dockerfile
version: '3.8'

services:
  app:
    build: .
    ports:
      - "5000:5000"
    environment:
      - DATABASE_URL=postgresql://admin:password@db:5432/tickets
    depends_on:
      - db
    networks:
      - tickets-network

  db:
    image: postgres:15
    environment:
      - POSTGRES_USER=admin
      - POSTGRES_PASSWORD=password
      - POSTGRES_DB=tickets
    volumes:
      - postgres-data:/var/lib/postgresql/data
    networks:
      - tickets-network

  prometheus:
    image: prom/prometheus
    ports:
      - "9090:9090"
    volumes:
      - ./prometheus.yml:/etc/prometheus/prometheus.yml
      - ./alert_rules.yml:/etc/prometheus/alert_rules.yml
    networks:
      - tickets-network

  alertmanager:
    image: prom/alertmanager
    ports:
      - "9093:9093"
    volumes:
      - ./alertmanager.yml:/etc/alertmanager/alertmanager.yml
    networks:
      - tickets-network

  grafana:
    image: grafana/grafana
    ports:
      - "3000:3000"
    volumes:
      - grafana-data:/var/lib/grafana
    networks:
      - tickets-network

  locust:
    image: locustio/locust
    ports:
      - "8089:8089"
    volumes:
      - ./locustfile.py:/mnt/locust/locustfile.py
    command: -f /mnt/locust/locustfile.py --host=http://app:5000
    networks:
      - tickets-network

volumes:
  postgres-data:
  grafana-data:

networks:
  tickets-network:
    driver: bridge
Prometheus Alert Rule
- alert: FlaskAppDown
  expr: up{job="flask-app"} == 0
  for: 15s
  labels:
    severity: critical
Flask retry logic
def connect_with_retry():
    retries = 10
    while retries > 0:
        try:
            with app.app_context():
                db.create_all()
            return
        except sqlalchemy.exc.OperationalError:
            retries -= 1
            time.sleep(3)
Challenges & Key Takeaways
CONTAINER STARTUP ORDER - FLASK RETRY LOGIC: One of the first challenges encountered when containerising the stack was a race condition between the Flask application container and the PostgreSQL container. When Docker Compose brought both containers up simultaneously, Flask would attempt to connect to the database before PostgreSQL had finished initialising — resulting in an immediate connection error and a crashed container. Simply using depends_on in the Compose file was not sufficient, as it only waits for the container to start, not for the database process inside it to be ready to accept connections. The solution was to implement a retry loop inside the Flask application itself, catching the connection error and reattempting the connection every three seconds up to ten times. This taught an important real world principle — in distributed systems, services must be designed to tolerate the temporary unavailability of their dependencies rather than assuming everything will be ready at the same time.
CONNECTING GRAFANA TO PROMETHEUS: One of the first challenges encountered when containerising the stack was a race condition between the Flask application container and the PostgreSQL container. When Docker Compose brought both containers up simultaneously, Flask would attempt to connect to the database before PostgreSQL had finished initialising — resulting in an immediate connection error and a crashed container. Simply using depends_on in the Compose file was not sufficient, as it only waits for the container to start, not for the database process inside it to be ready to accept connections. The solution was to implement a retry loop inside the Flask application itself, catching the connection error and reattempting the connection every three seconds up to ten times. This taught an important real world principle — in distributed systems, services must be designed to tolerate the temporary unavailability of their dependencies rather than assuming everything will be ready at the same time.
TRIGGERING/ROUTING ALERTS THROUGH ALERTMANAGER Configuring the alerting pipeline required understanding how Prometheus and Alertmanager work together as separate but connected components. Prometheus evaluates alert rules against the metrics it collects, but it does not handle notification routing itself — that responsibility belongs to Alertmanager. The FlaskAppDown alert rule was defined in a separate alert_rules.yml file, which Prometheus was configured to load alongside its scrape configuration. When the Flask container was stopped, Prometheus detected that the scrape target was unreachable and moved the alert through three distinct states — inactive, pending, and finally firing — before forwarding it to Alertmanager. Seeing this pipeline work end to end reinforced how production alerting systems are deliberately separated into evaluation and routing concerns, making each component independently configurable and easier to maintain at scale.